Cost Reports
This walkthrough is aimed at first-time users of Argonaut looking to visualize their cloud costs using the dashboard and create reports.
As of now, we only support cost dashboards and reporting for AWS accounts. GCP costs is in the works and will be added soon.
Cloud Connection
To start, visit Settings > Connections to connect your AWS account.
New users can choose to connect your cloud account in a read-only IAM connection (Cost Management only) or choose to provide admin access through IAM (for infra provisioning functionalities, and app deployments). Both these connections are exclusive and you'll need two connections if you would like to use cost and deployment features.
Existing users of Argonaut should provide a new read-only IAM connection for the Cost Management functionality.
Data ingestion delay
Once you connect your cloud, Argonaut gains read-only access through an IAM role and asks the cloud provider to generate cost data and store it in the intermediate S3 Bucket (on your cloud). This is done through our CloudFormation template.
This process is executed periodically and as a result, obtaining data takes 24 hours in most cases and may take up to 48 hours.
Once the data is available, you can head on over to the Cloud Cost section from the sidebar.
Under this, you will find Dashboard and Reports.
Navigating the dashboard
Here’s a quick overview of the dashboard
- Click on Dashboard.
- This will bring up three sections of the dashboard where you can see sections titled All Accounts, All Regions, and All Resources. Each of them has four columns by default. The first column lists all the instances of that particular type.
- Cost - Cost incurred in the selected period.
- Previous cost - Cost incurred in the previous period.
- Difference - The change (in percentage) between the two periods.
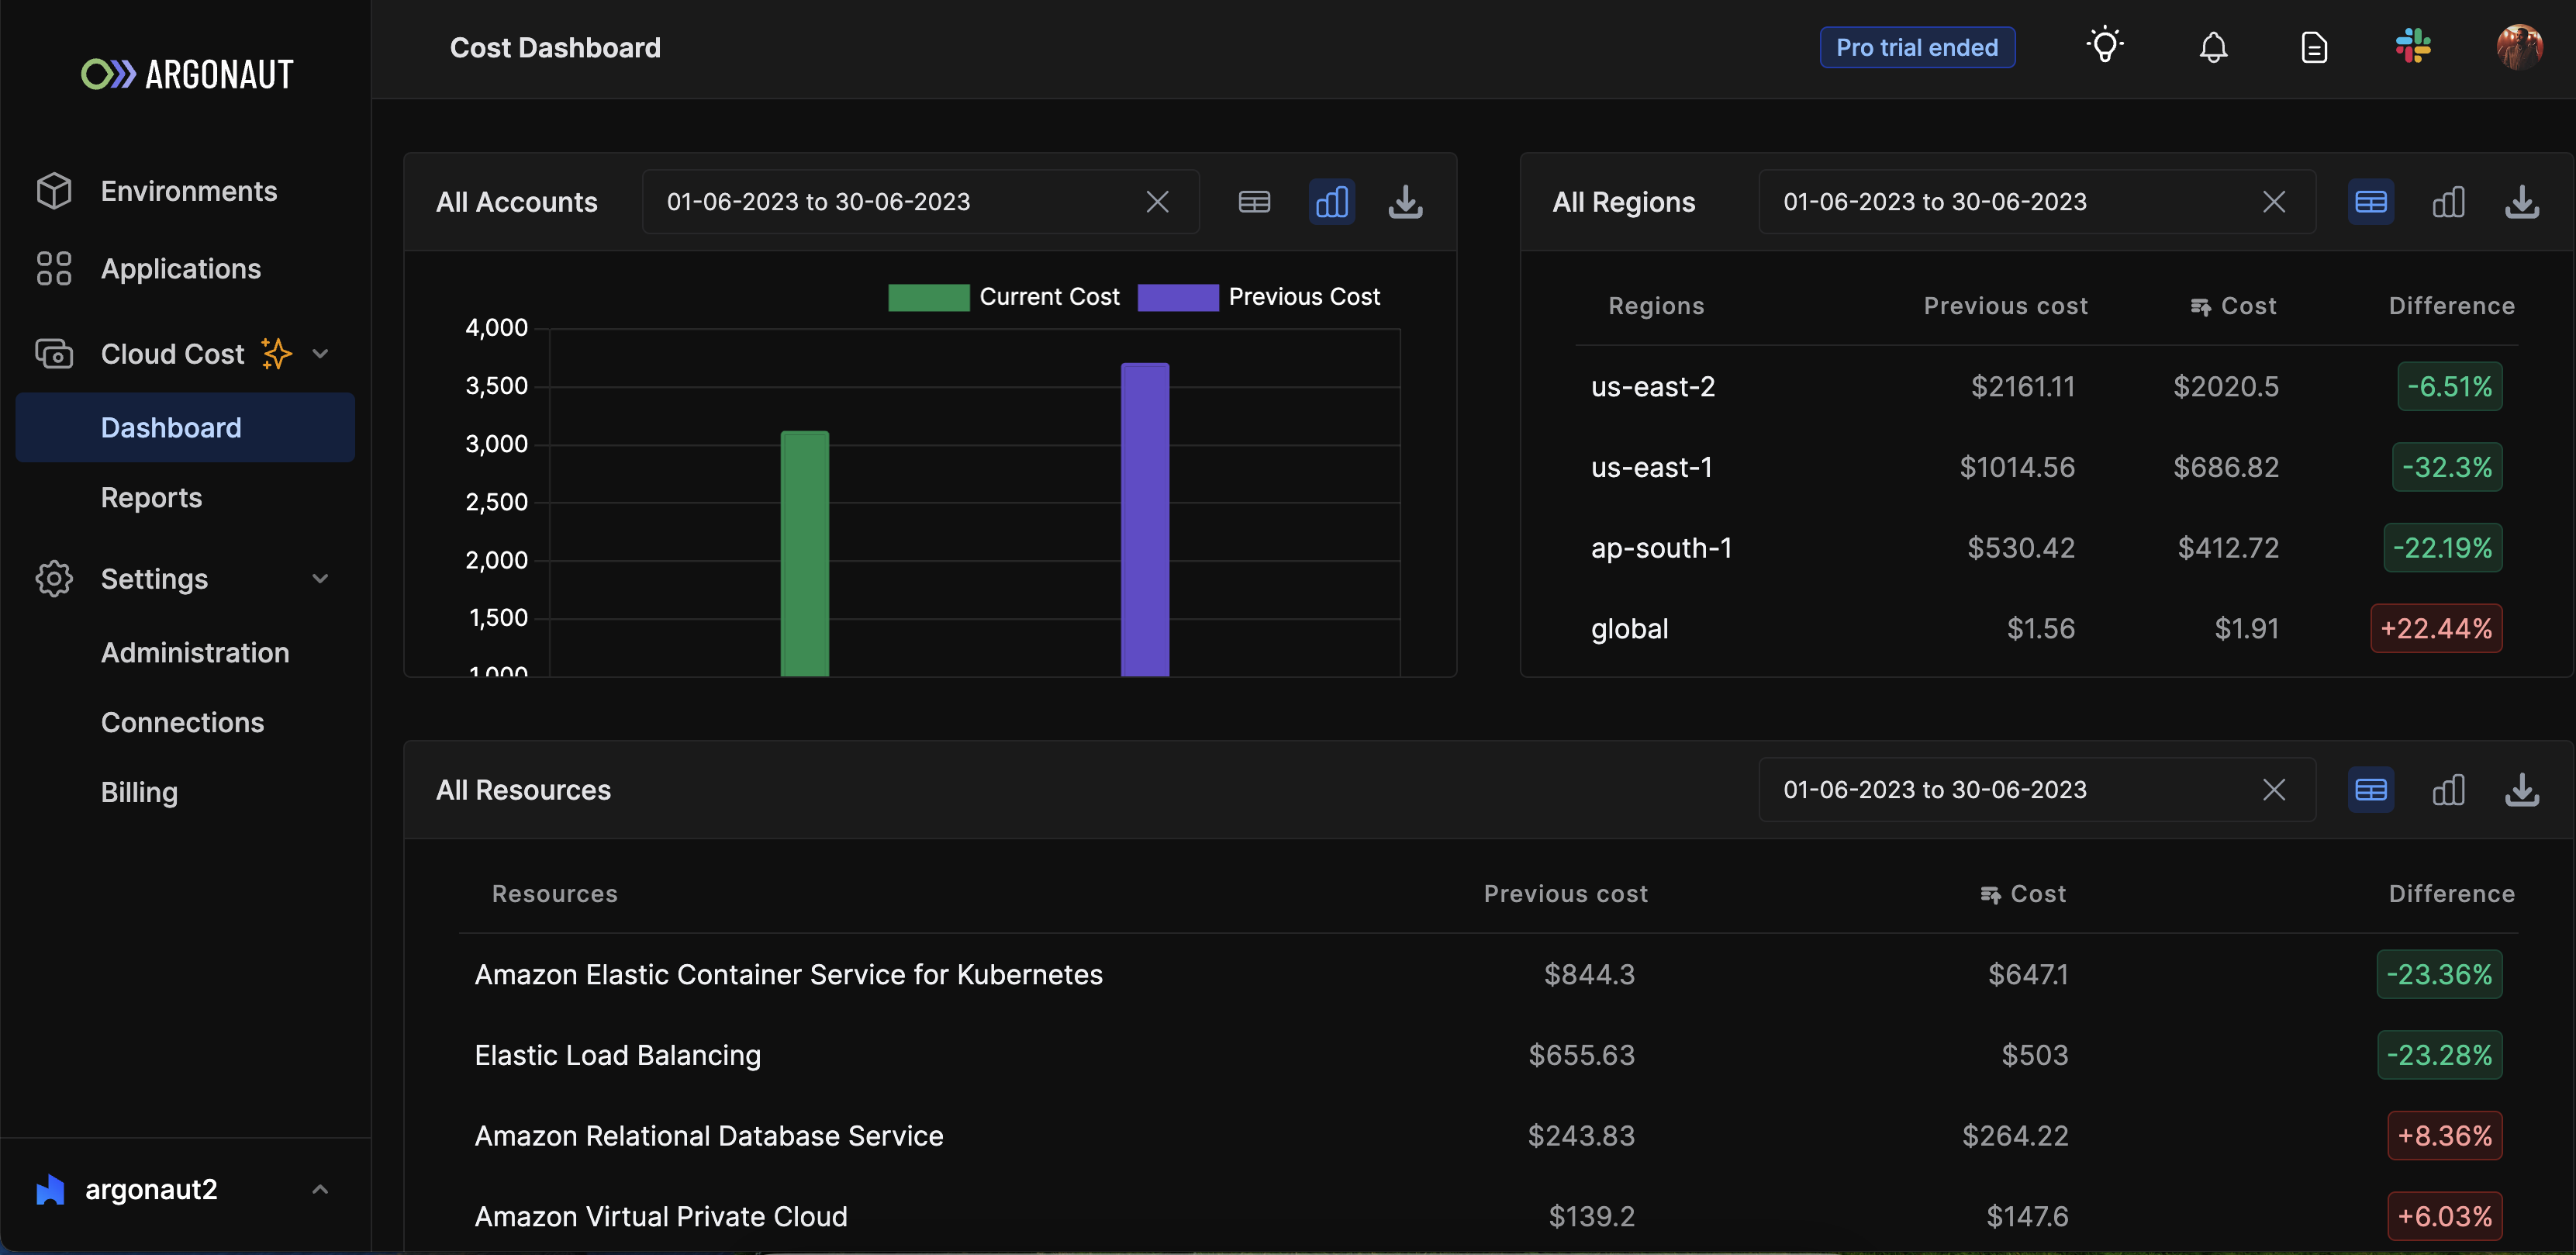
- Each section offers two views. A table view and a graph view.
- You can now update the date to the chosen range.
Creating reports
Once you have explored the basic dashboards, you also have the ability to create custom reports. Start by selecting “Reports” from the sidebar.
You will find any previously created reports below.
Select
Report +to create a new report.Now, you will see a new screen open up showing the total cost of the previous month of cloud usage in a graph view. Along with a table below with resource-level breakdowns.
Give a name to your new report. And start customizing the report.
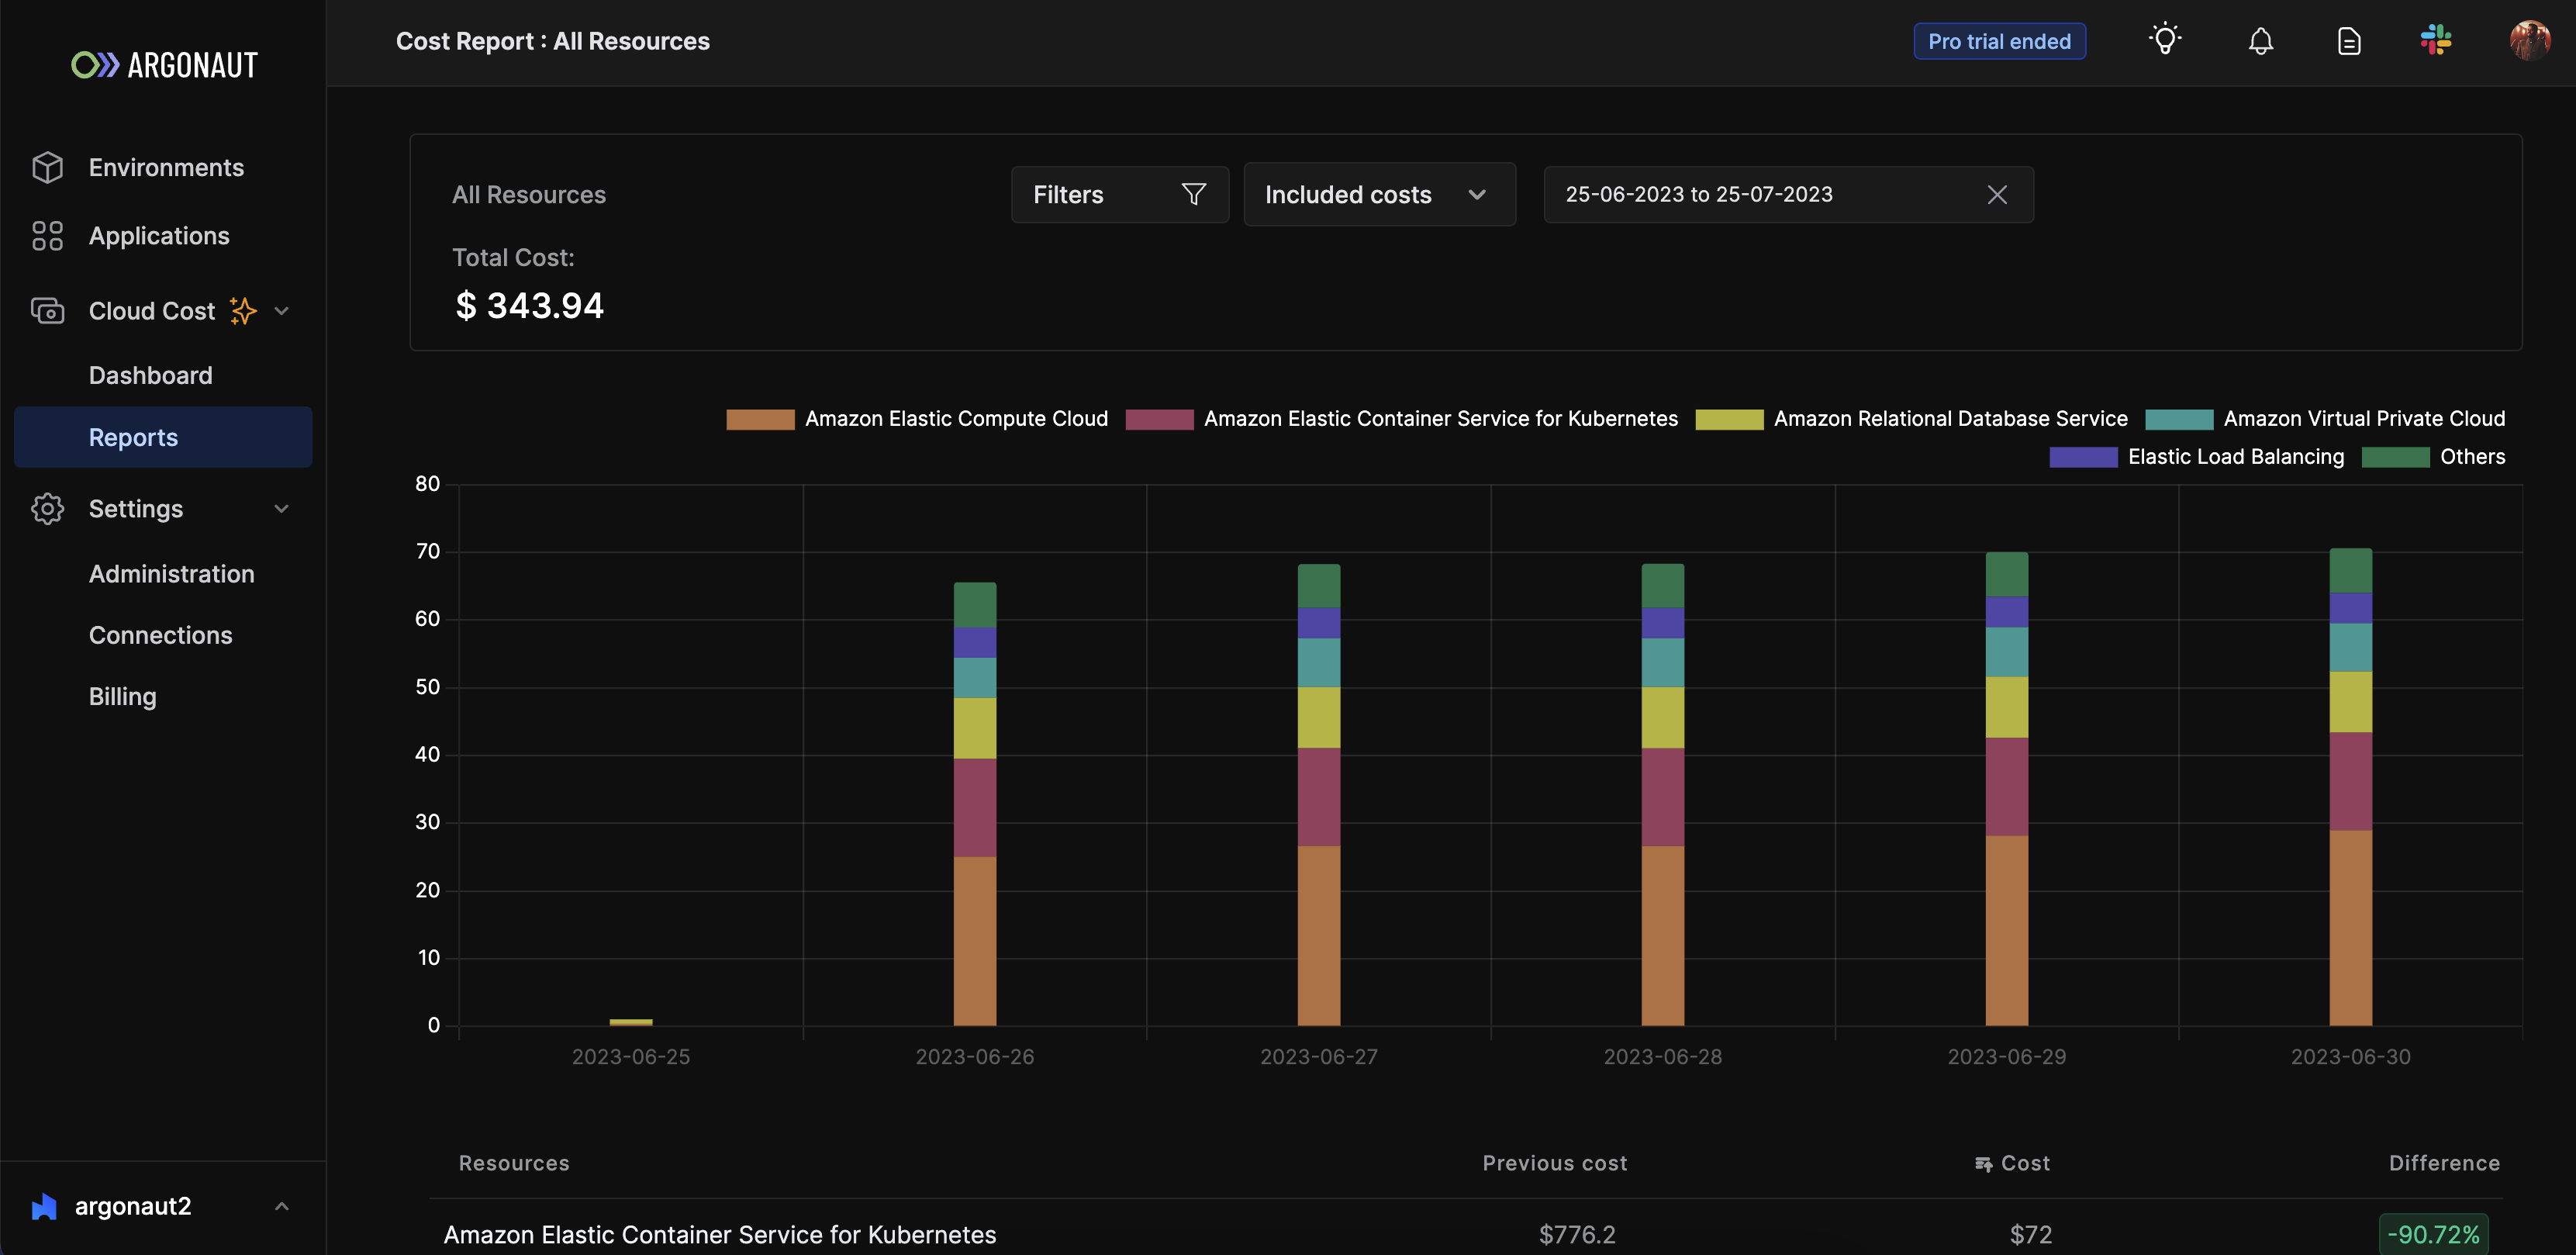
Using filters, you can easily view specific costs associated with individual or multiple accounts, regions, or resource types.
This enables efficient cost management by allowing you to focus on specific components of your AWS usage.
Example: From “AWS” Where “Resource_type” is (“AWS Lambda” + “Amazon Elasticache”)
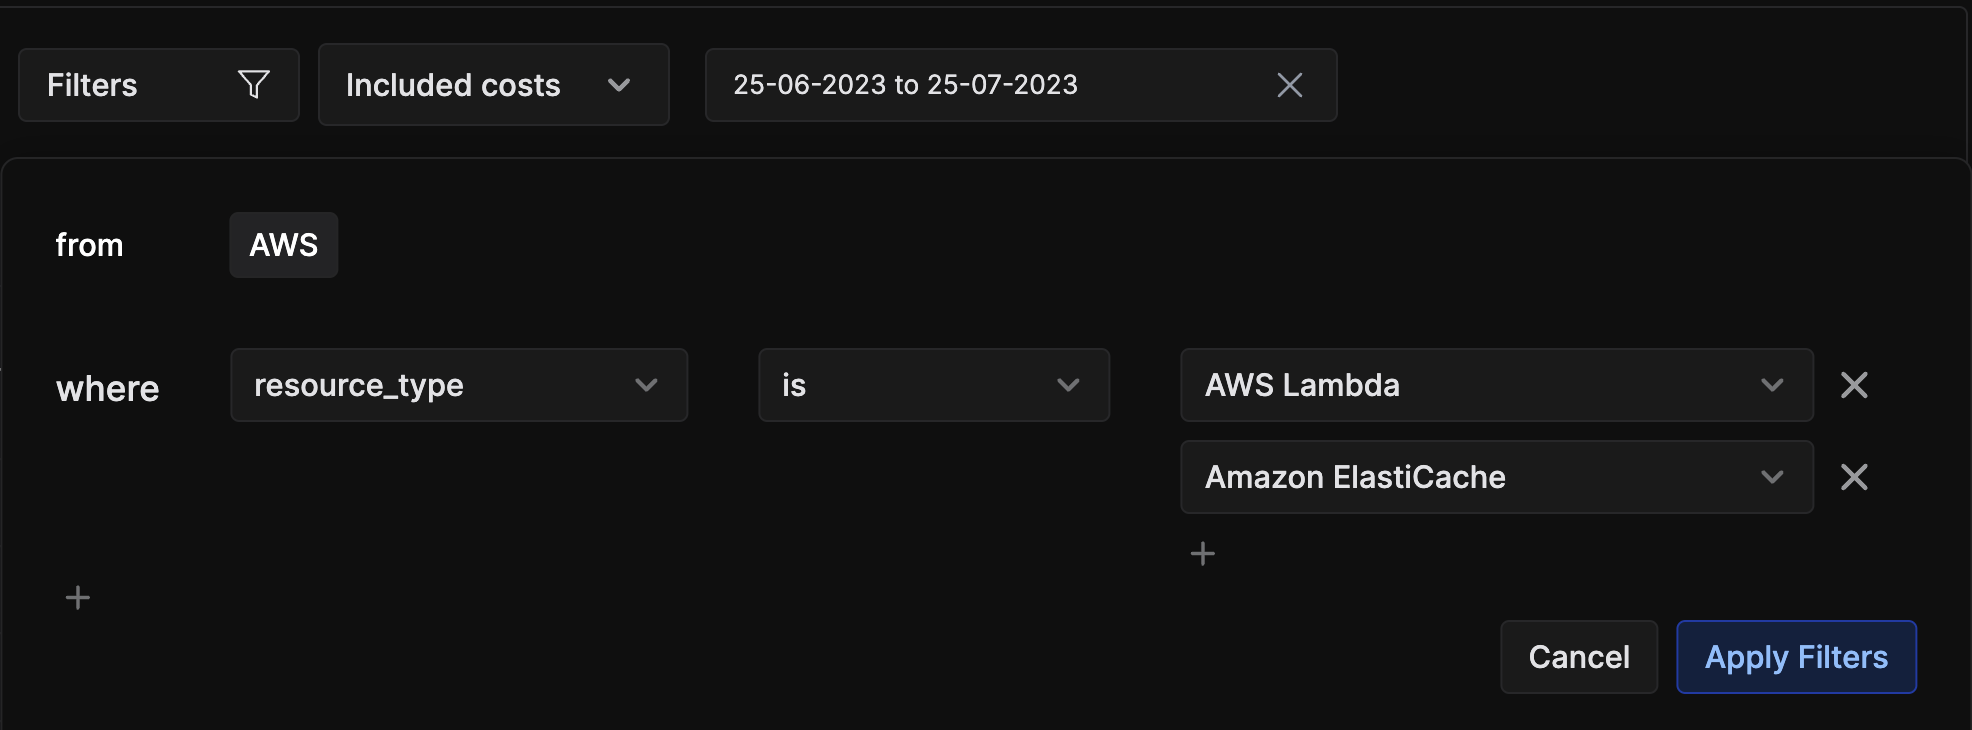
To specify multiple dimensions in one query, click the
+sign on the left side. This dropdown will show the other dimensions you haven’t used in the previous step. For example, region.By default, you get usage costs displayed. You can also choose to include Credits, Discounts, Refunds, and Taxes in your custom report.
Finally, set the desired date range to see your chosen values.
Once this is set, click on
Create Reportto save the report.These can be accessed anytime from the Reports tab in the sidebar.
Existing reports can also be updated at will. We have an unsaved changes indicator to show when there are unsaved changes. Click on Update to save the changes.
Tip: To see the cost of resources along with their resource name/IDs, click on the resource in the table below. This view cannot be saved separately but will be available inside of your saved report for future reference.
You can sort your reports by name or by last modified time.
Data stored
Argonaut asks cloud providers to generate cost data and store them in an intermediate storage. (AWS S3, etc.)
Argonaut doesn’t store any data on the intermediate storage on its own, the stored data is generated by the cloud provider.
Permissions needed
For AWS
You can get started with the cost feature by providing minimal read-only permissions.
Argonaut requires read only access to the IAM role.
There's also a one time S3 bucket create action that occurs during setup.
FAQs
- What does “data not present” mean?
- Argonaut pulls cost data from cloud providers on a daily basis. If you access dashboards or reports before this data is synced to Argonaut’s systems, you would encounter this situation.
- Please wait for a period of 24-48 hours to allow Argonaut to sync data from cloud providers.
- Are data in reports automatically updated?
- Yes. Report data comes from the synced data, which happens on a daily basis.
- What is the limit under the free tier?
- Unlimited for now. If your billing costs are over $100K/month, reach out to us so we can understand your needs and serve you better.
- Are reports visible to everyone in my workspace?
- Yes. The idea is allow everyone to get an idea of the organizations’ costs by viewing/managing reports. This allows for more visibility into cloud costs.
- How do I share reports with my team?
- There's no access controls on your reports as of now. All reports are public, and accessible to everyone in your workspace. We will soon be adding option to export your reports in various formats.
- What are Credits, Refunds, Discounts, and Taxes in reports?
- These refer to cloud providers’ cost types; for AWS, the most common cost types are usage, credits, refunds, discounts, taxes.
- Usage is the default one where you pay for on-demand instances usage (and is the one reflected when none of the 4 options are selected).
- Credits are promotional credits (startup credits, etc.)
- Discounts, Refunds and Taxes are self-descriptive.
- The data is not consistent with my AWS billing console. Why is that?
- If you think that your cost data is inaccurate, then there might be two scenarios:
- Your integration was created recently: Argonaut doesn’t have access to historical data, hence, leading to the drift in data.
- The Argonaut cost S3 bucket was modified: If the bucket was modified, Argonaut might not be able to pick up cost data correctly leading to data drift and inaccuracies in cost reporting.
- If you think that your cost data is inaccurate, then there might be two scenarios:
- This is great for visualizing my costs. How do I start saving?
- Get in touch and we can help you get started. Recommendations will be built into the product for self-serve in upcoming releases.
- Why am I unable to view historical data?
- When you create a new cost management integration, Argonaut asks the cloud provider to prepare cost data. Since providers start generating/exporting data from the current timestamp, Argonaut doesn’t have access to historical data.
- How do I delete the integration?
- Follow these steps to ensure clean deletion of our cost integration wtih AWS.